
Weclome back to Capitol Chatter: A quarterly analysis of congressional tweets, where we help you keep track of what Congress is tweeting.
Ahead of the midterm election, we saw an increase in tweets about the economy, including a particular focus on the terms “tax” and “inflation.” This quarter, we also looked into members’ tweets about major pieces of legislation from the last few years, seeing which drove the most volume. Spoiler alert: the Infrastructure Investment and Jobs Act received the most activity.
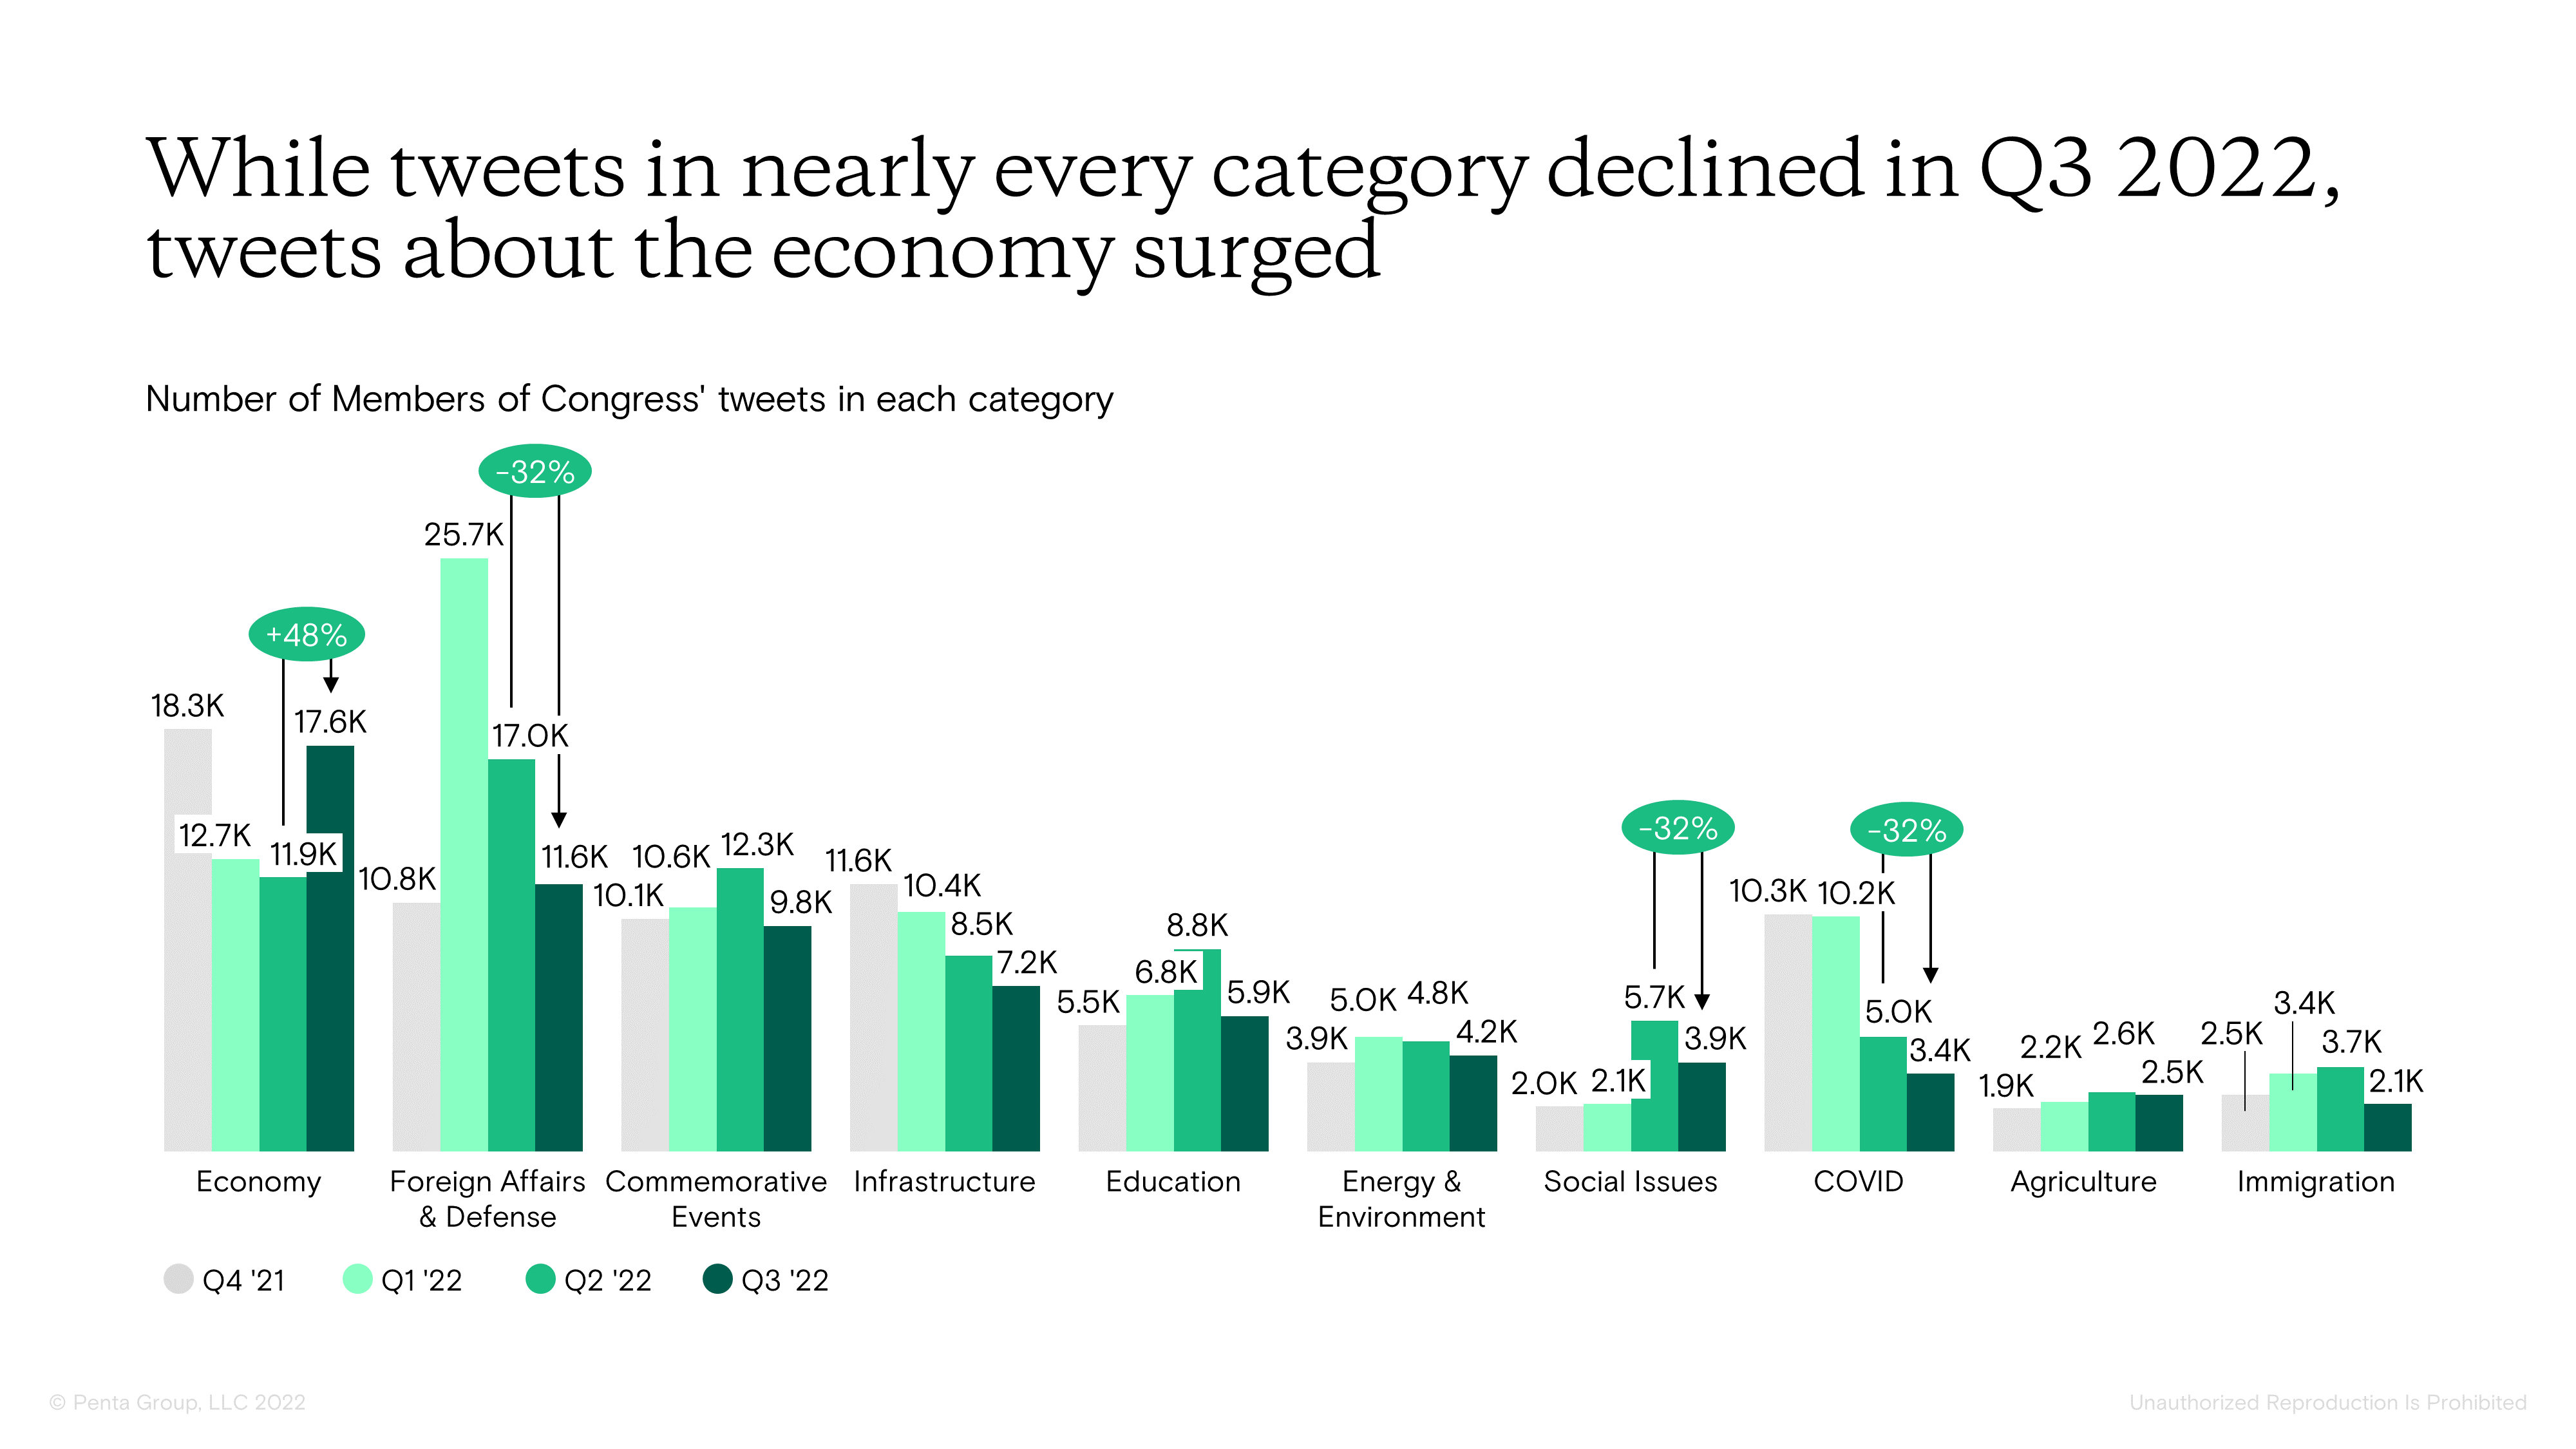
In Q3, congressional Twitter accounts posted 123,567 tweets. This marked a 9.5% decrease from the second quarter, with tweet volume declining in nearly every category (due to Congress’ August recess). Foreign affairs and defense continued to fall from its peak in Q1 as members of Congress shifted focus away from the ongoing Russian invasion of Ukraine. Meanwhile, discussion of the economy rose 48% from Q2 and became the most tweeted-about topic, driven by an increase in tweets containing terms related to inflation, taxes, and jobs.
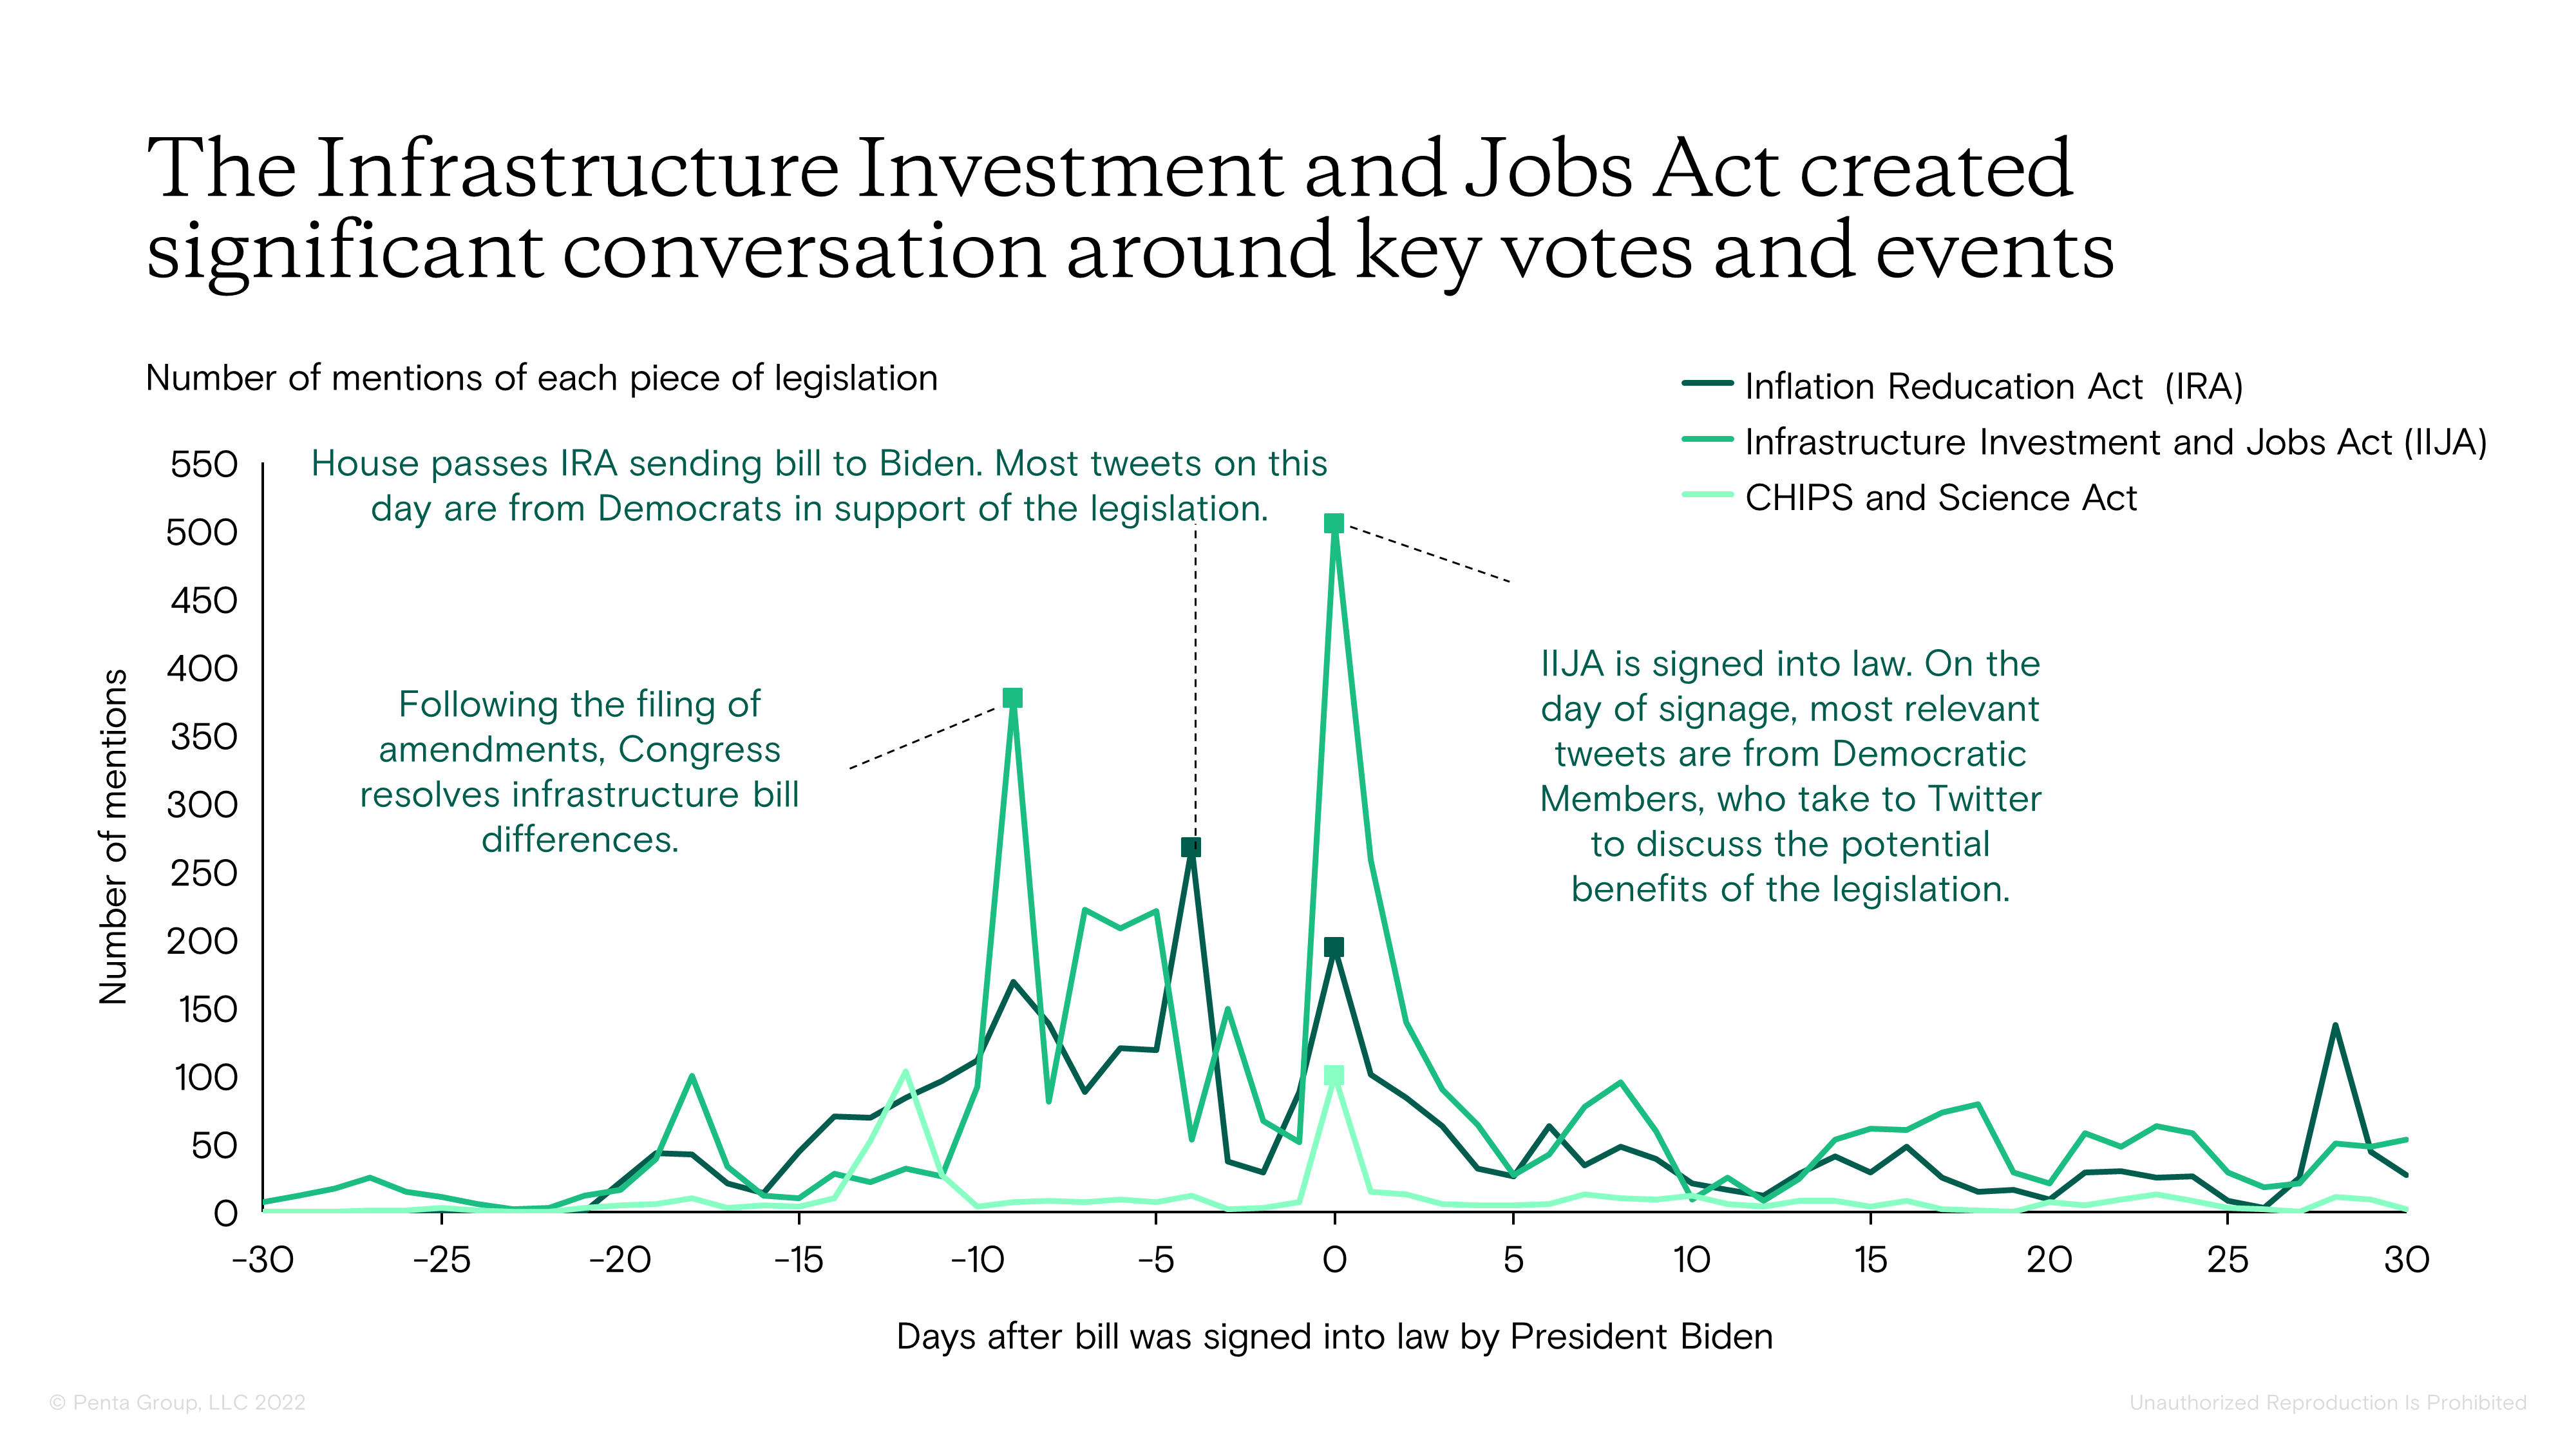
As the first half of President Biden’s term in office comes to a close, we took a look at how three of the most significant pieces of legislation that eventually reached the President’s desk and were signed into law—the Inflation Reduction Act (IRA), the Infrastructure Investment and Jobs Act (IIJA), and the CHIPS and Sciences Act—drove activity on congressional Twitter. In the 30 days before and after the signing of each of these bills into law, the Infrastructure Investment and Jobs Act generated the most congressional Twitter activity. Activity spiked most on the day it was signed, largely driven by Democratic members touting the legislation’s potential benefits. While it generated significant media attention due to its impact on numerous American companies, the CHIPS and Sciences Act did not see strong congressional engagement on Twitter.
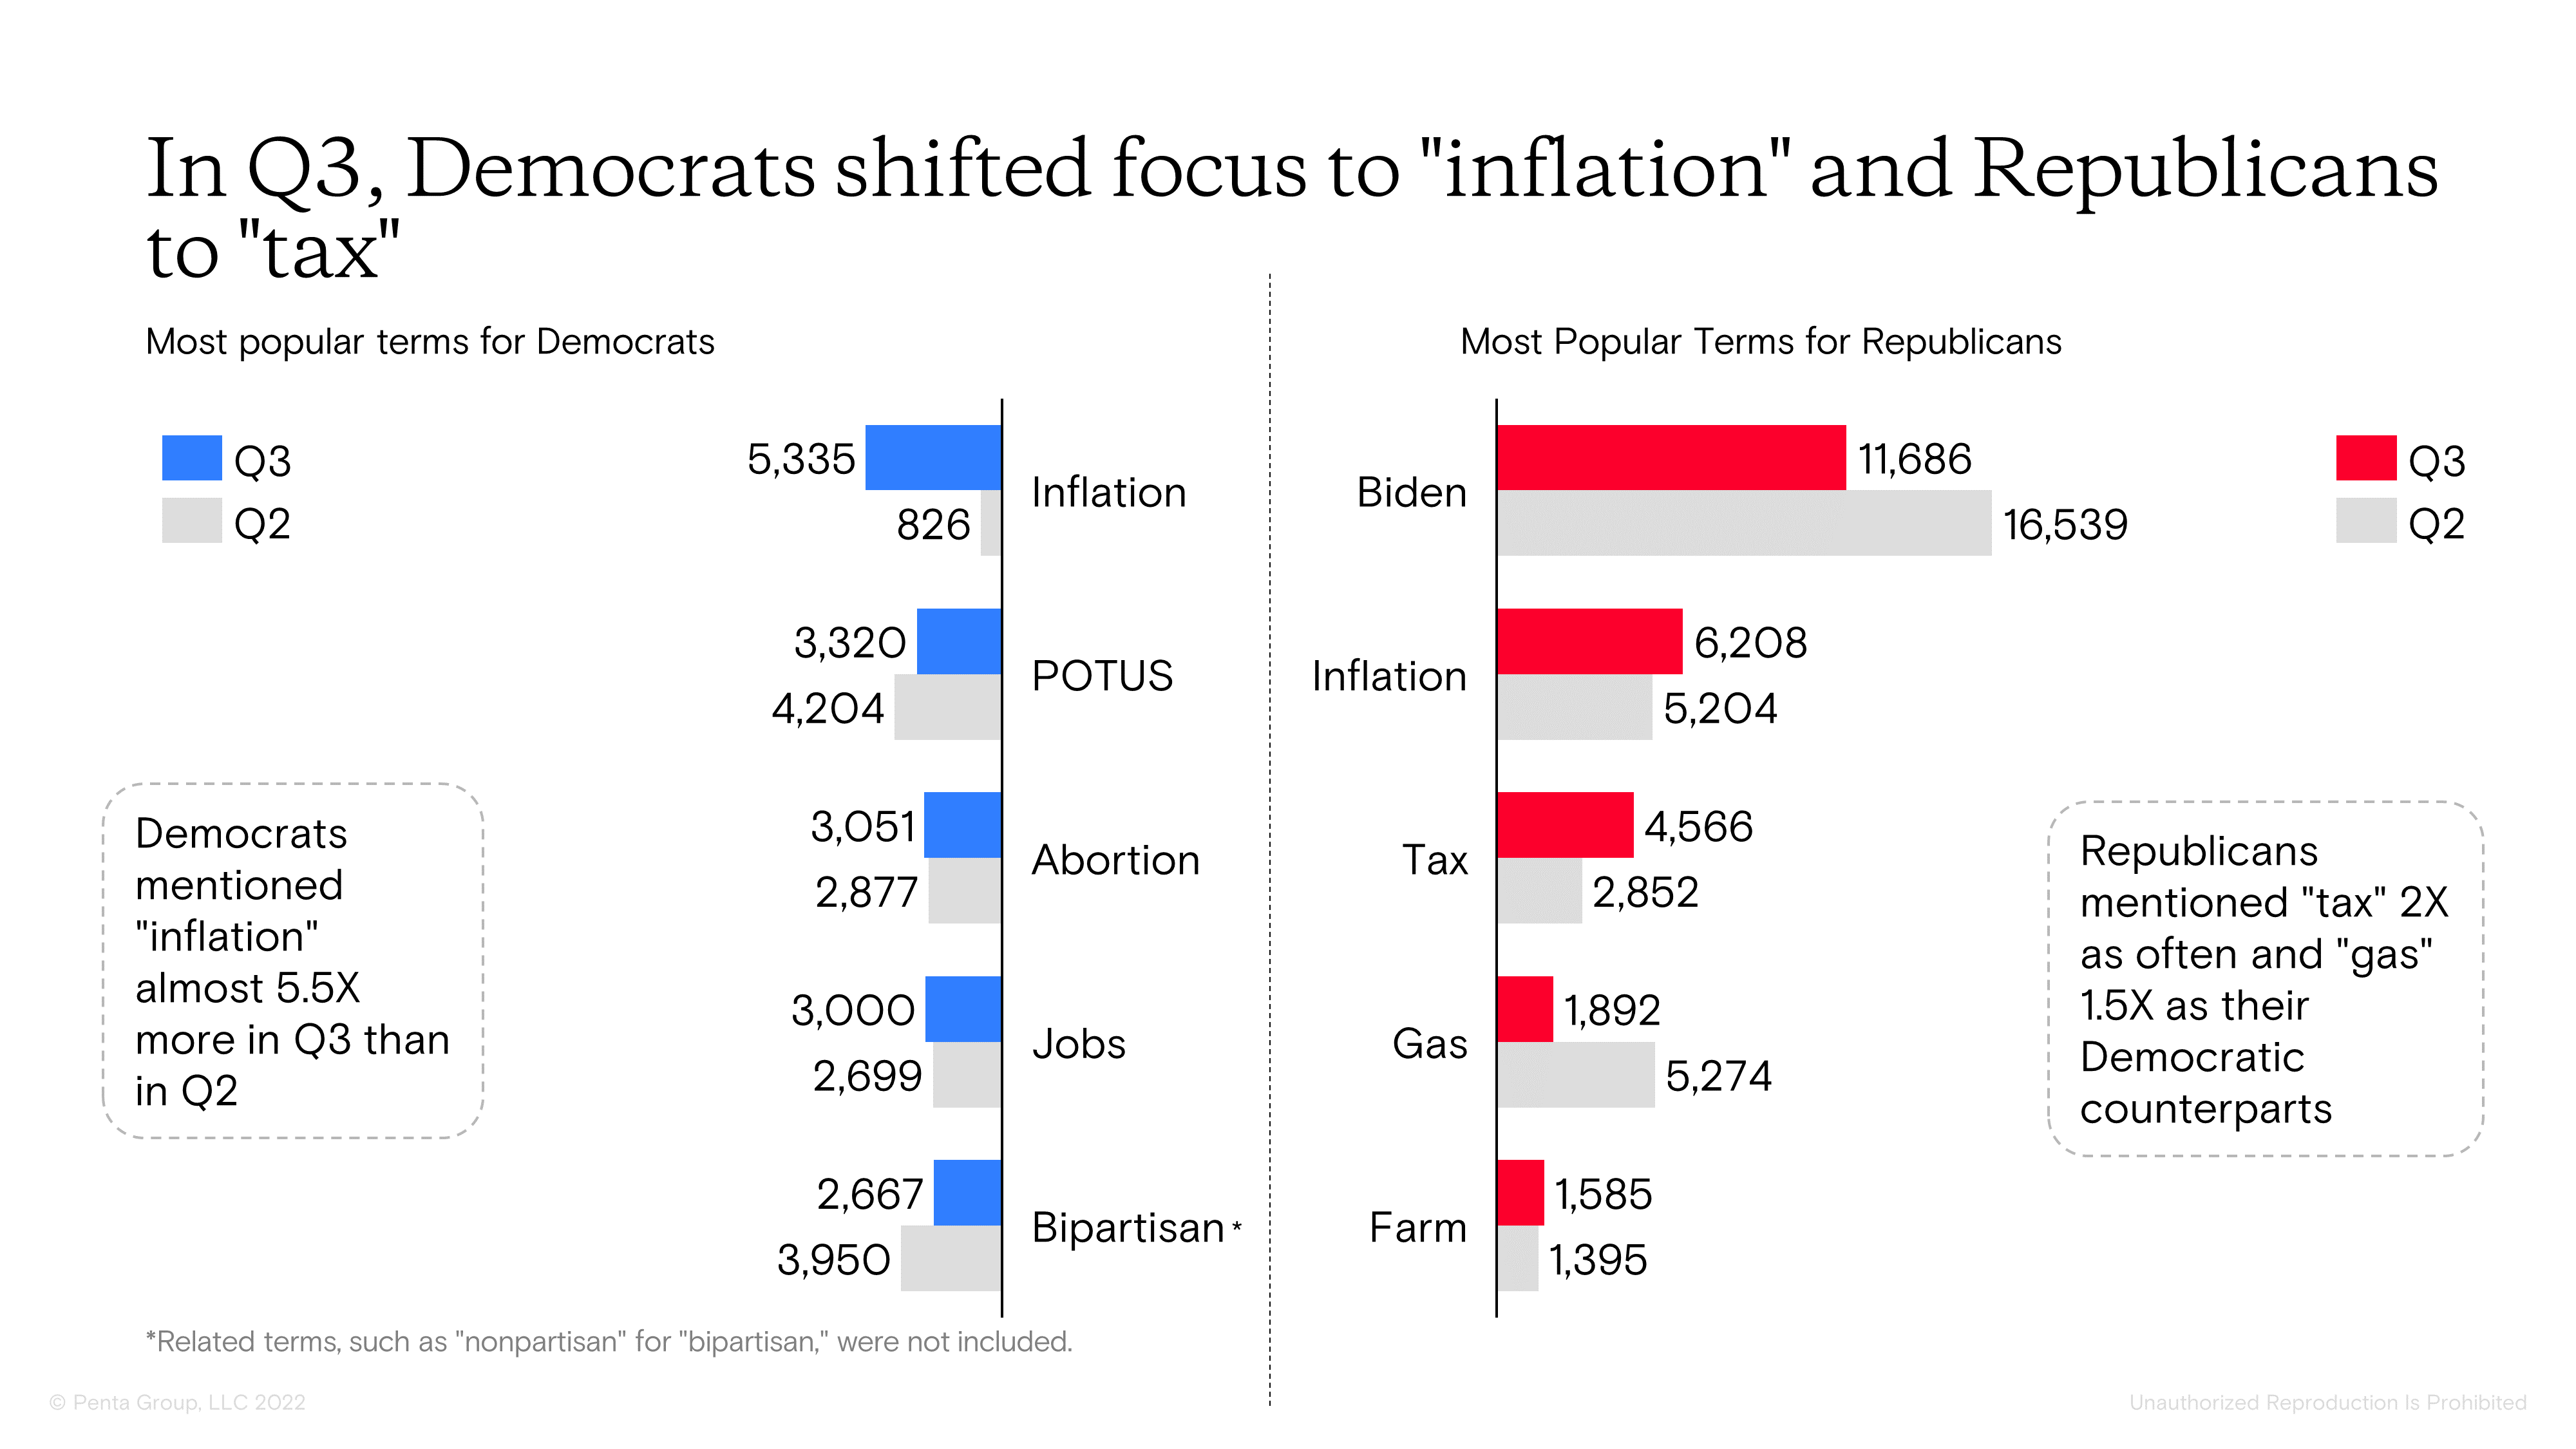
Democrats’ and Republicans’ differing viewpoints and messaging on the economy were on full display in Q3, as both parties sought to highlight their approaches to the economy in the leadup to the midterm elections. For example, both parties focused on “inflation”, but Republicans often mentioned “tax,” criticizing plans for increased taxes during a period of heightened inflation, while “jobs” was a major topic for Democrats as they highlighted strong jobs numbers. Notably, Democratic members of Congress mentioned “inflation” in tweets 5.5X more in Q3 compared to Q2, with most tweets championing the benefits of the Inflation Reduction Act.
The parties also differed in how they tweeted about President Biden. In an ongoing trend, Republicans mainly referred to the President as “Biden”—in fact, the term “Biden” was by far the most tweeted term by Republican members of Congress, while Democrats tended to tag the President’s handle directly (@POTUS).
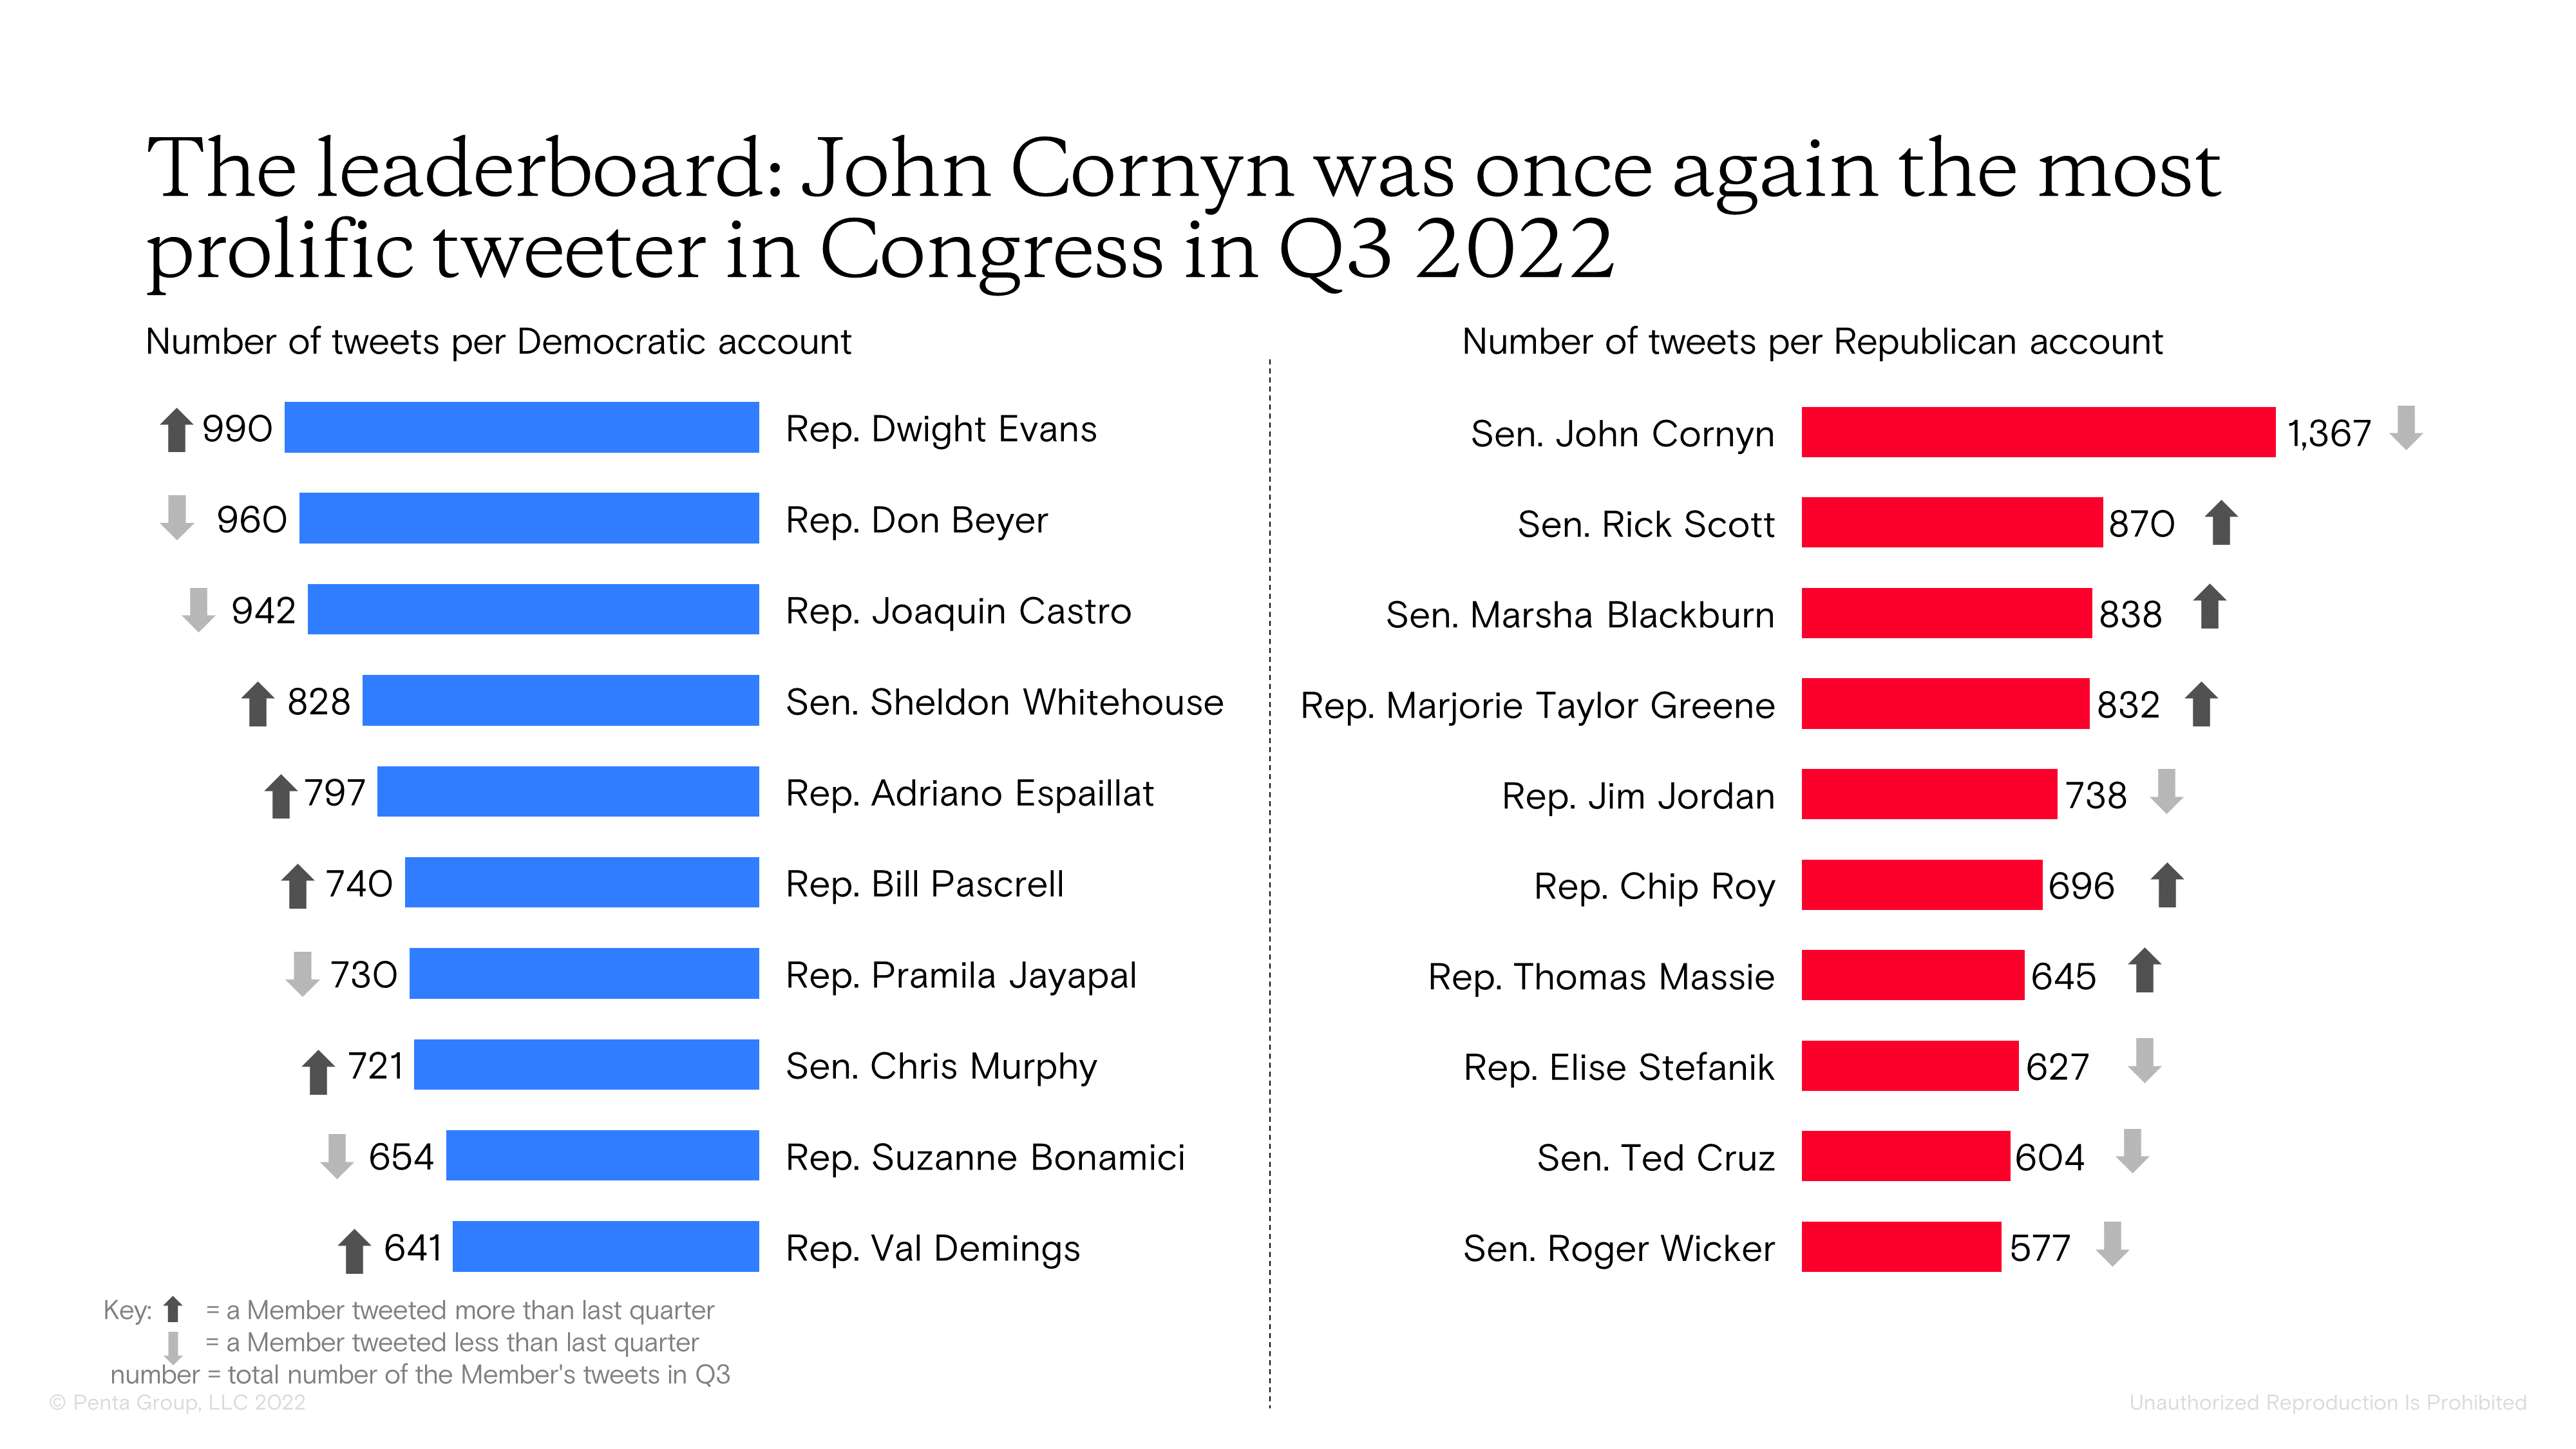
The reigning leader board champion Senator John Cornyn (R-Texas) remained the most prolific tweeter in Q3, even as his overall volume of tweets decreased by 4.4% from Q2 to Q3. Members of Congress on the leaderboard tweeted significantly more than other members of their parties. On the Democratic side, these top 10 members tweeted, on average, 800 tweets in Q3, while the rest of the Democratic members tweeted an average of 203 times. Similarly, the top 10 Republican tweeters posted an average of 779 times in Q3, whereas the rest of the Republican members tweeted an average of 156 times.
Methodology
Penta conducted text analysis on tweets and retweets from members of Congress and congressional committee accounts that were posted between July 1, 2022 and September 30, 2022. In total, we searched for more than 300 keywords in each of the 123,567 tweets to determine which topics were discussed in each. In this analysis, independent Senators Bernie Sanders (I-Vt.) and Angus King (I-Maine), who caucus with the Democratic Party, were treated as Democrats. Charts and numbers may vary slightly from quarter to quarter given methodology adjustments.